Screenshots
In this section, you will find images of the most commonly used screenshos and a brief descriptions of the most popular features of OZEKI Cluster.
Overview
Home pageCluster IP settings
Set Computers
Set Services
File synchronization
Set boot delay
Set alerts (in e-mail, SMS, twitter or phone call)
Log window
System Information page
Login page
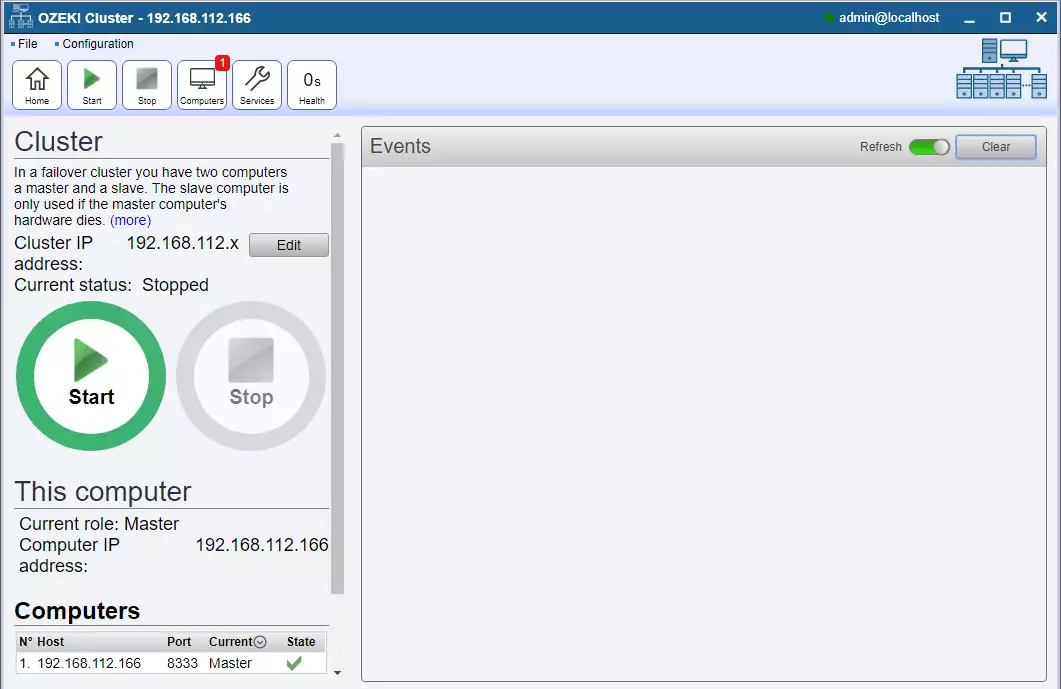
After logging in we find ourselves directly on the Ozeki Cluster home page, (Figure 2) where you can find the most important information about the software. The page is divided into 3 main sections. On the left side, you can edit the Cluster IP address, start or stop the service, and observe the computers' current roles (master, slave1, slave2 ... slave10). You can also see the services added to the cluster.
In the middle section, you can see useful information about the cluster events, which may include warnings, errors (marked with red color), reports, and general information.
A narrow menu bar is located on the right side of the page where you have access to the 'Computers' and 'Services' pages. The 'Home' button is also located here. You can jump back anytime to the 'Home' page, since these 3 buttons will always be there.
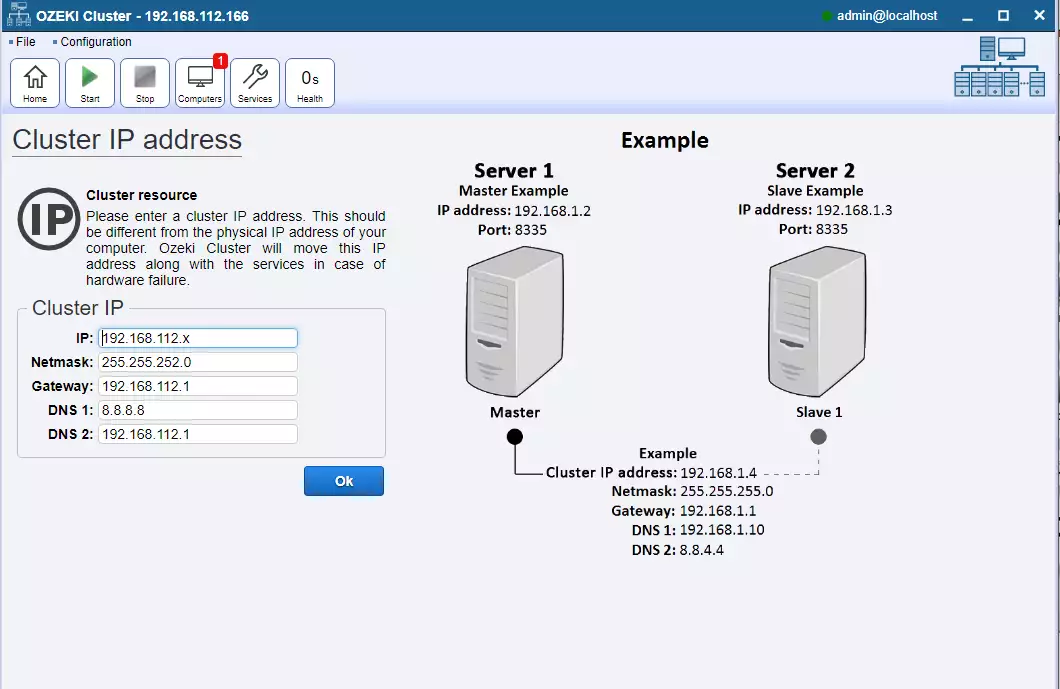
Cluster IP
Figure 3 shows the page where you can set or change the settings of the cluster. This is usually the first thing to do when creating a cluster system.
Computers
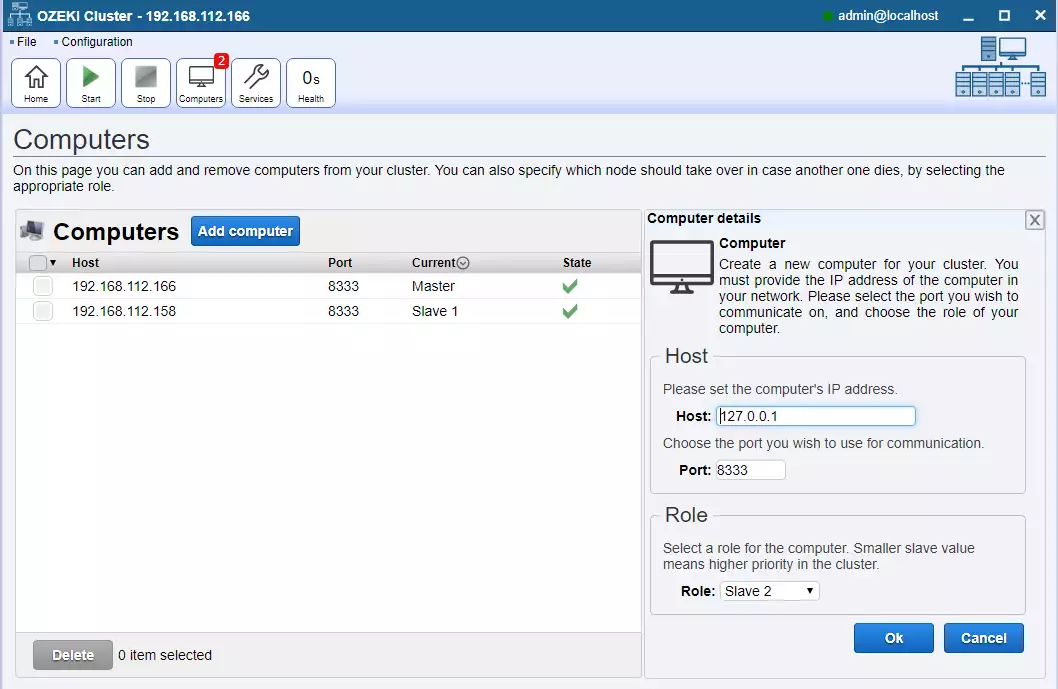
Figure 4 shows the 'Computers page', where you can add or remove computers from the list. When you click on the 'Add' button, you have to give the computer's IP address, the port number, and also you have to select the role for that device (master, slave1, slave2 ... slave10).
Services
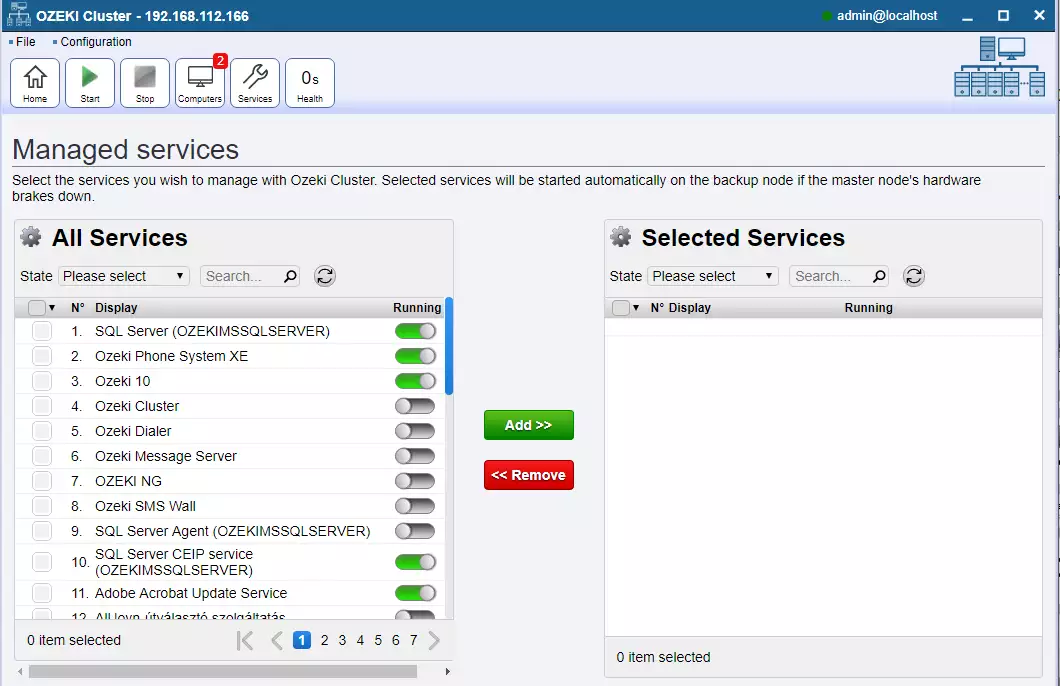
The 'Service selection page' is shown in Figure 5. As the page title says, you can select your services here. In the 'All services' list you can see details of the services your computer has (both running and not running services). If you would like to select a service, click on the checkbox next to it, and then press the 'Add' button.
File synchronization (more about synchronization)
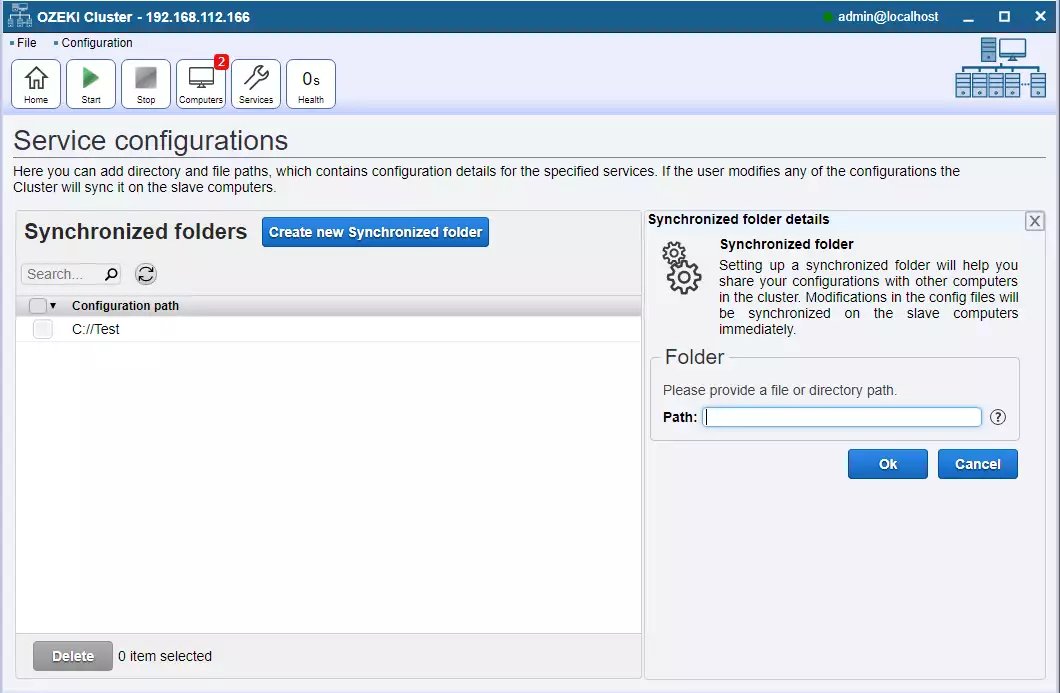
Ozeki Cluster is capable of synchronizing files between the nodes. It is advised to synchronize the service configuration files. You just have to give the destination folder of the files to be transferred and Ozeki Cluster will mirror those files to the slave nodes. You can do this by clicking the 'Add' button and then type the access path of the file in the window to the right. This file synchronization function can be reached if you choose the 'Settings' menu on the top of the page and then click on the 'Service configs' submenu.
Boot delay
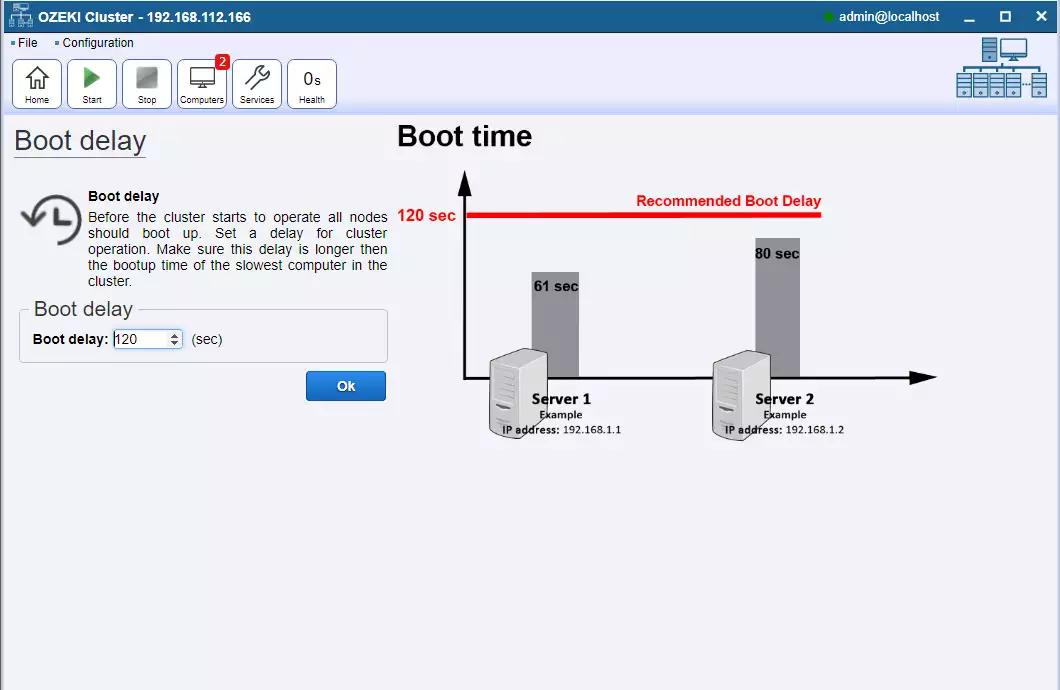
Figure 7 shows the page where you can set the boot delay. Make sure the boot delay is set longer than the bootup time of the slowest booting computer in the cluster.
The boot delay has 2 important roles:
- When you power up all of the computers in the cluster at the same time, the fastest booting computer will start counting up to the boot delay. After it has finished counting, it will start running the service(s).
- When the master goes offline, the 1st slave in the list will continue to run the service(s). This slave will count the boot delay, and it will ping the master everytime the time defined in the boot delay elapses. If the master is online, the service(s) will continue to run on it.
Alerts (more about Alerts)
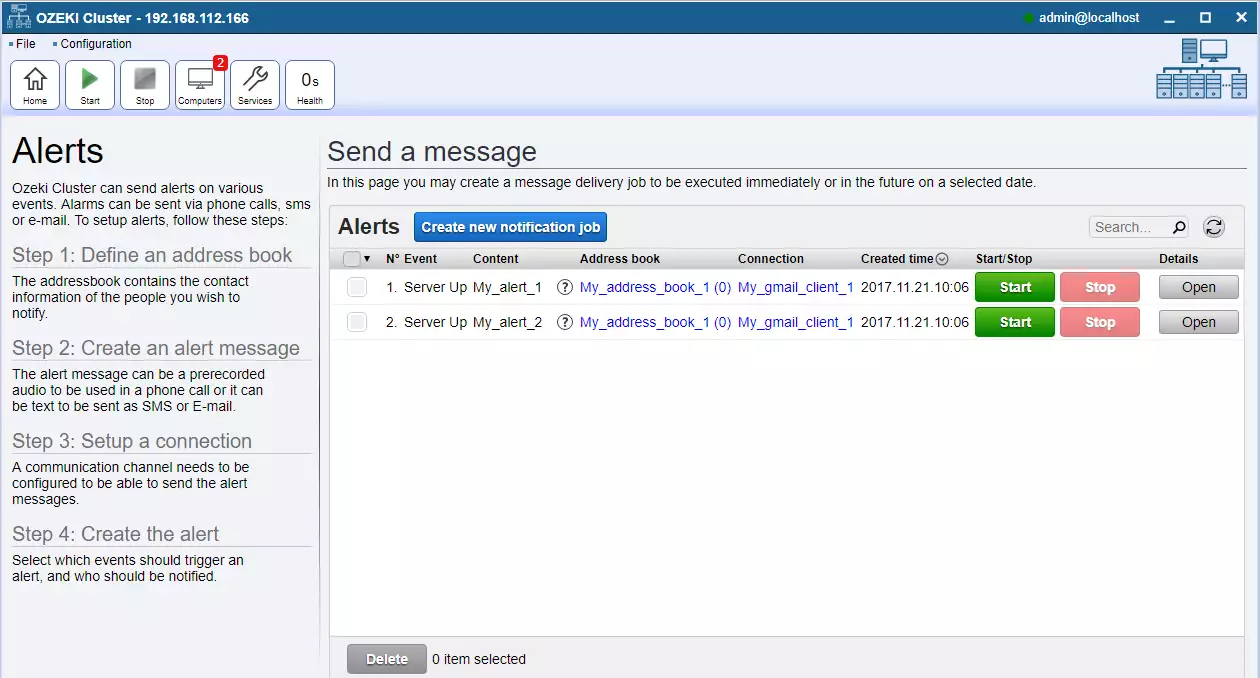
On the alerts page, (Figure 8) you can set up alarms to get e-mail, SMS, twitter or voice notifications from Ozeki Cluster to multiple addresses or phone numbers when a
master or slave node
turns up or down.
Alert examples:
'server is up Cluster started on: 192.168.112.127'
'server is up An offline Slave come online: 192.168.112.142'
'server is down Master went offline: 192.168.112.127. The new master is: 192.168.112.142'
'server is down Slave went offline: 192.168.112.133'
A customised message can also be added before the alert message.
Logs
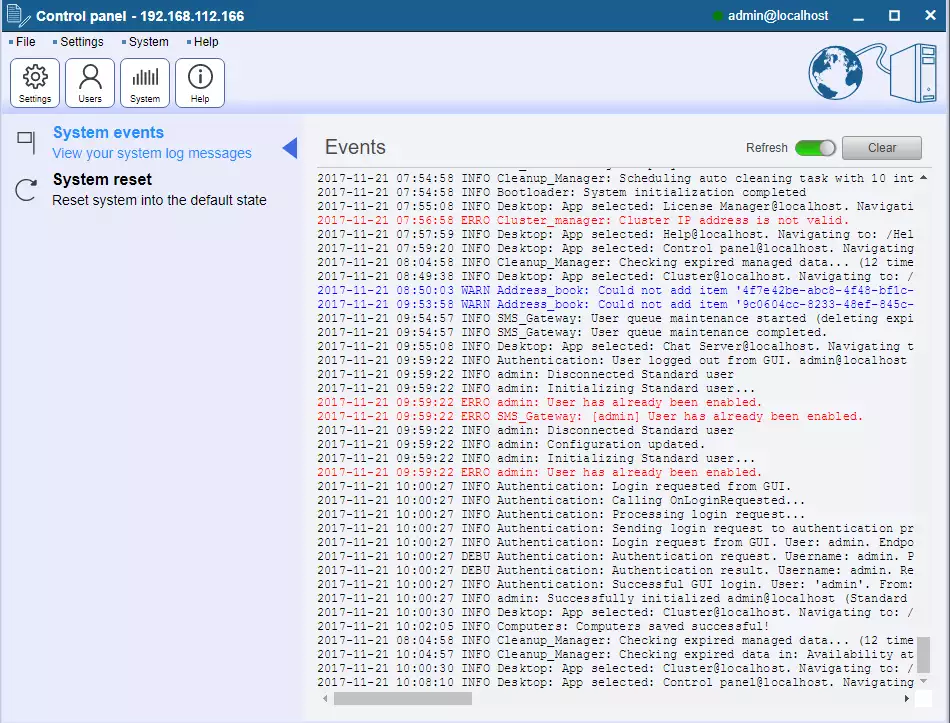
In the 'Logs page', (Figure 9) you can follow the cluster events. For example: status of keep alive packages, warnings, errors (marked with red color) and other useful information.
System Information
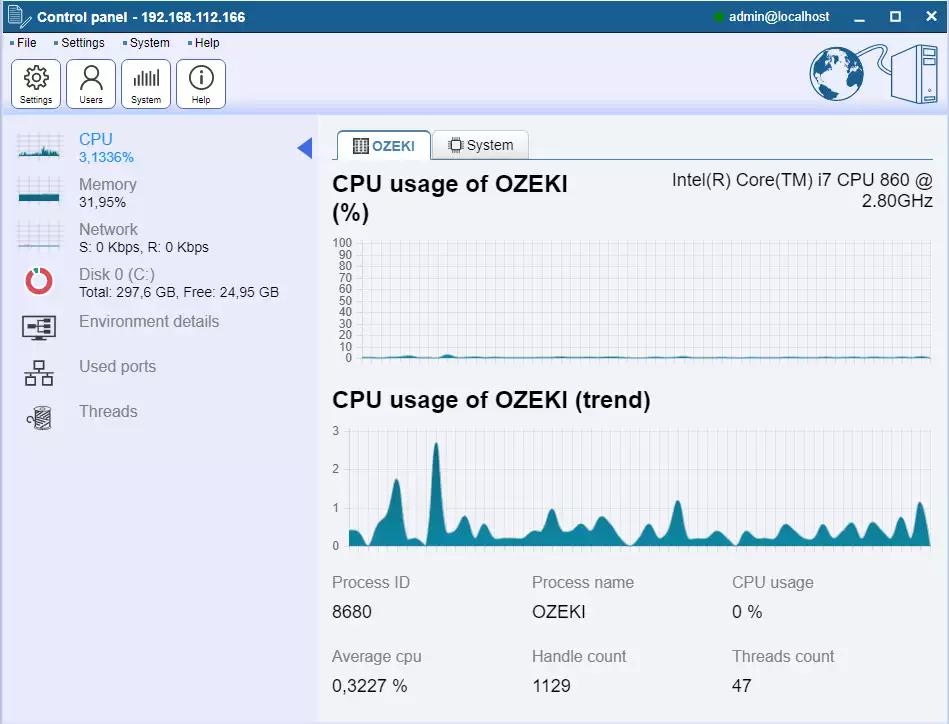
In Figure 10, you can see a glimpse of the 'System information page'. This page contains general and cluster specific information about the CPU and memory usage.
It also shows the disk space usage of every disk. The last system information tab is called 'Environment details', which contains the Motherboard ID, HDD ID, Processor ID,
Operating system install date, Operating system serial number and Kernelbase.dll creation date.
